What is the Heikin Ashi technique in trading?
Piece written by Alexa Smith, Trive Financial Market Analyst
Heikin Ashi directly translates to “average pace”, which makes sense as each of the candlesticks on the Heikin Ashi chart plot from the middle of the candlestick before it.
Formula:
The Heikin Ashi technique is usually employed alongside traditional candlestick charts to identify market trends and future prices when trading. While traditional Japanese candlesticks help establish good entry points by displaying potential reversals or breakouts, the Heikin Ashi chart helps traders establish whether to remain during a sustained trend or exit as the trend pauses or reverses.
Some traders use the Heikin Ashi chart as an alternative to traditional Japanese candlesticks, as the chart may give higher confidence levels when deciding whether to stay in a trade or not, while others use it in conjunction with traditional Japanese candlesticks.
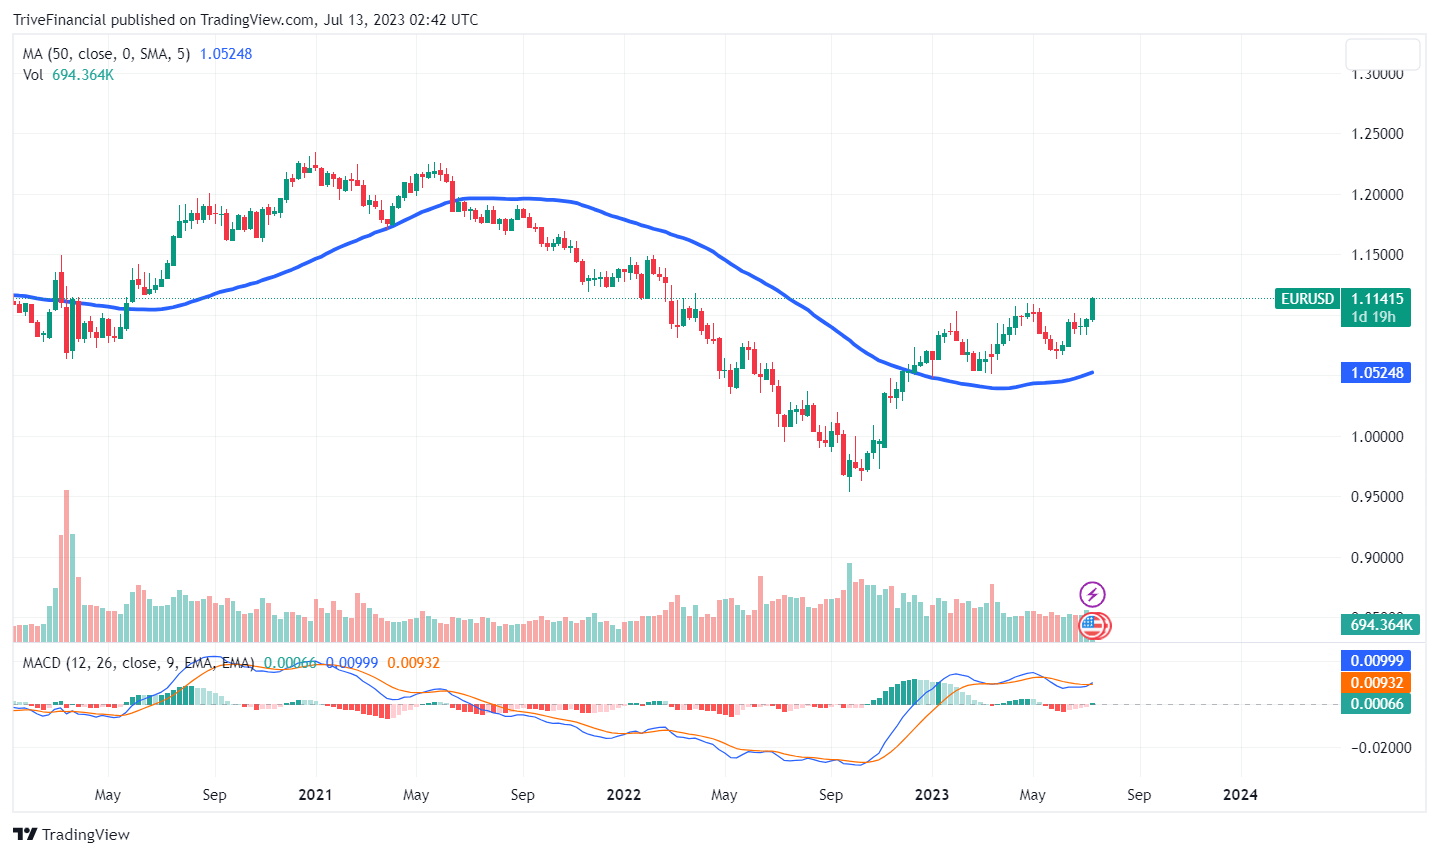
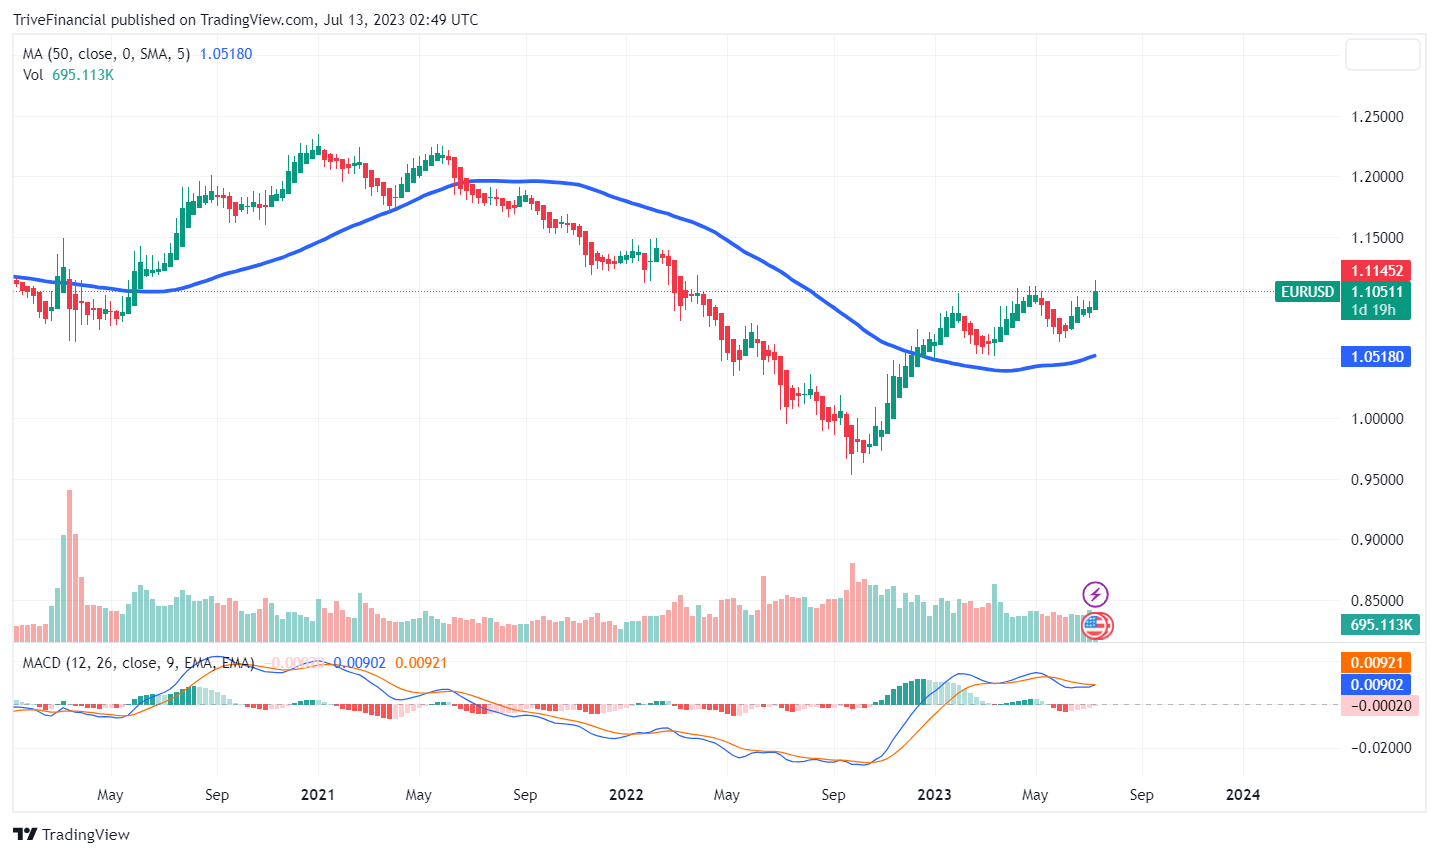
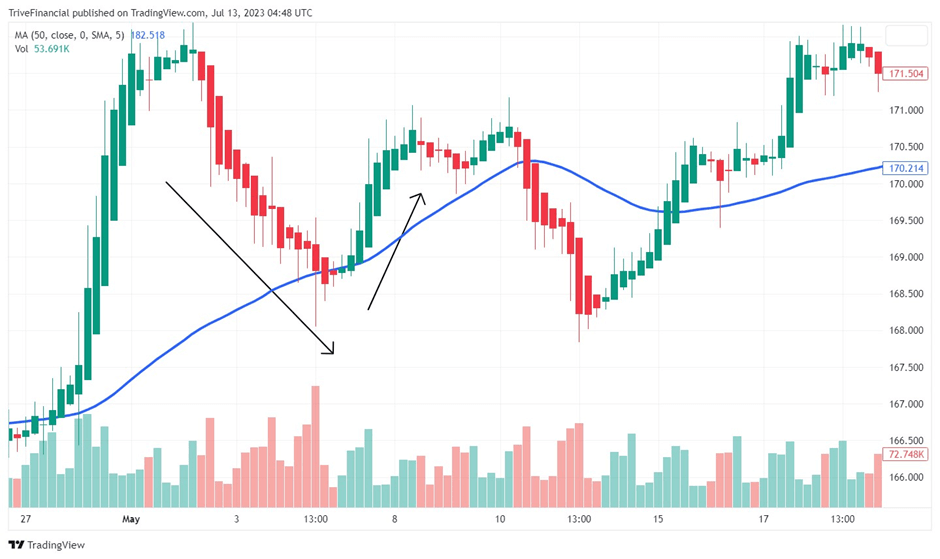
The following two graphs plot the EURUSD currency pair. While the charts look similar, the first chart displays traditional Japanese candlesticks, while the second displays the Heikin Ashi.
Source: TradingView, Trive Financial Services Malta Limited
The Heikin Ashi chart looks smoother because the chart takes an average of the movement of traditional Japanese candlesticks. Furthermore, candles on traditional charts alternate between green and red even if the price level is moving in a particular direction, with green indicating that the underlying asset is trading at a higher level than the previous day’s close and red indicating that it is trading at a lower level to the previous day’s close. Meanwhile, Heikin Ashi candles focus on the general trend by staying red during a downward trend and staying green during an upward trend.
Additionally, a traditional candlestick chart displays the current price of the underlying asset. However, the Heikin Ashi chart displays an average calculation; hence the current price may not align with the price at which the market is trading. For this reason, platforms incorporate two prices on the Y-axis: one represents the calculation used for Heikin Ashi, while the other indicates the current price of the underlying in question.
Heikin Ashi candlesticks have smaller wicks than traditional candlesticks because they are calculated based on averages. Therefore, similarly to traditional candlesticks, the shorter the wick, the stronger the trend.
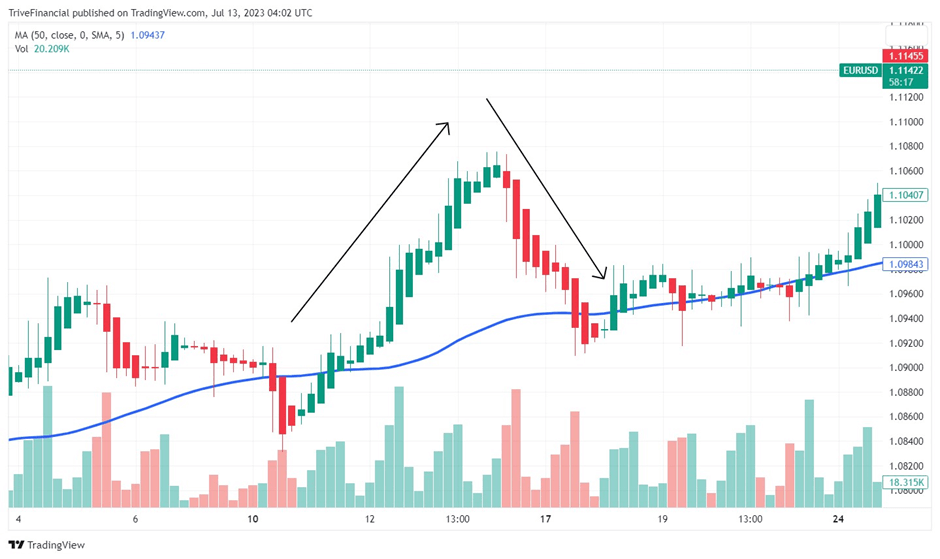
The below graph depicts the EURUSD currency pair. Green candles with no wicks below are indicative of a strong upward trend, whereas red candles with no wicks above are indicative of a strong downward trend. Hence, Heikin Ashi charts can be used to identify trend strength and direction.
Source: TradingView, Trive Financial Services Malta Limited
Candles that have no wicks on one end are called shaved candles.
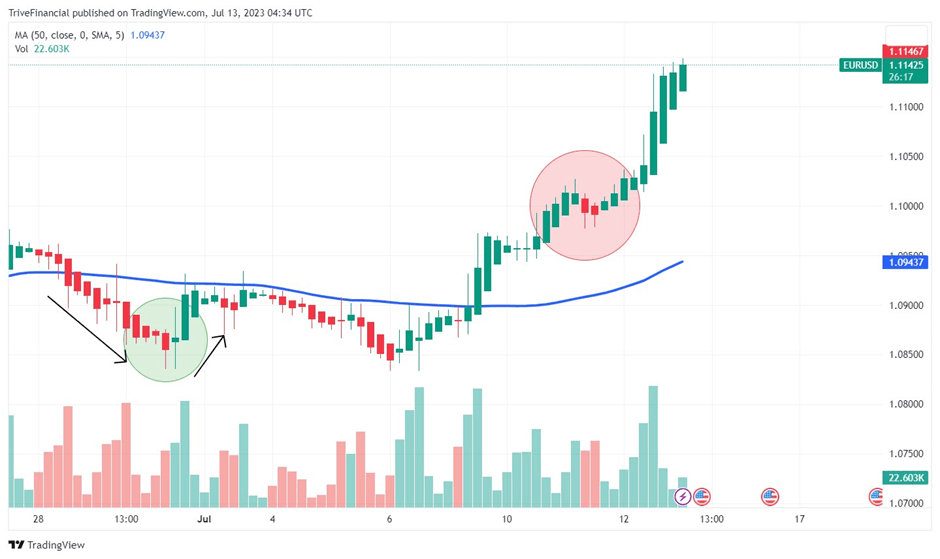
Furthermore, candles with small bodies and wicks on either side indicate a possible trend reversal or a pause. The green circle on the chart below shows that the small candles with wicks on either side marked a trend reversal from downwards to upwards. Meanwhile, the highlighted red circle indicated a pause in the upward trend.
Source: TradingView, Trive Financial Services Malta Limited
The Heikin Ashi chart may make locating trends easier as the movements are not interrupted by false signals in the form of market noise. As lower wicks get longer on a downward trend, buying pressure may start to build, followed by a reversal upside, as seen below. While smaller candles with wicks on either side may signify the opposite, as explained above.
Source: TradingView, Trive Financial Services Malta Limited
Summary
Heikin Ashi could be a helpful technique for determining trend direction and trend strength, when utilized properly and depending on the trader risk objective and management strategy. Plotting Heikin Ashi candles involves an average calculation rather than individual price points; hence the start of the following candle is the middle of the prior. Heikin Ashi can be used in technical analysis to determine potential pauses or reversals by filtering out market noise, making it easier to spot trends. However, it does not show the market’s current prices, hence, traders should use it in conjunction with technical indicators and at their own discretion.
Sources: TradingView, Investopedia
CFDs are complex instruments and come with a high risk of losing money rapidly due to leverage. 73% of retail investor accounts lose money when trading CFDs with this provider. You should consider whether you understand how CFDs work and whether you can afford to take the high risk of losing your money.
This material is provided for informational purposes only and does not constitute financial, investment or other advice. No opinion contained in this material constitutes a recommendation by Trive Financial Services Malta Limited or its author as to any particular investment, transaction or investment strategy and should not be relied upon in making any investment decision. In particular, the information does not take into account the individual investment objectives or financial circumstances of the individual investor. Trive Financial Services Malta Limited shall not be liable for any loss, damage or injury arising from the use of this information.