How is the automobile stocks landscape changing?
Piece Written by Nkosilathi Dube, Trive Financial Market Analyst
The automobile industry is not just about cars and trucks; it encompasses a wide range of companies involved in manufacturing, designing, marketing, and selling vehicles.
Automobile company stocks offer a unique blend of innovation, technological advancements, and global economic trends, making them an intriguing option for both seasoned investors and those new to the stock market.
The Most Valuable Automobile Stocks
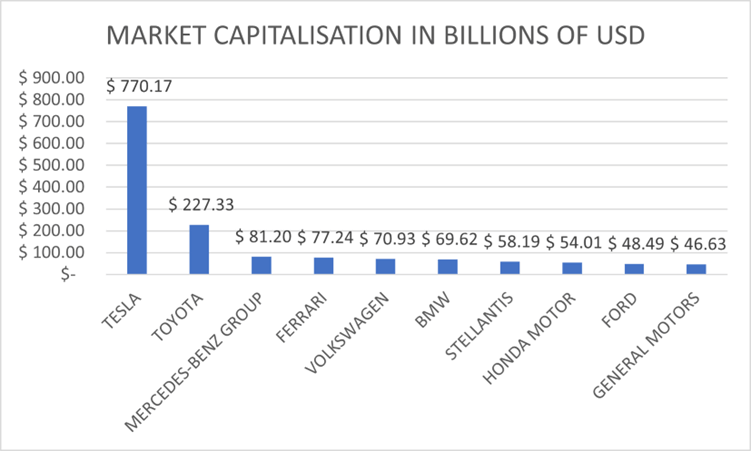
The top 10 automobile stocks hold a substantial approximately €1.4 trillion share in the global stock market, underscoring their significant influence. Half of these legacy brands hail from Europe, a hub of motor engineering.
Source: Trive – TradingView, Nkosilathi Dube
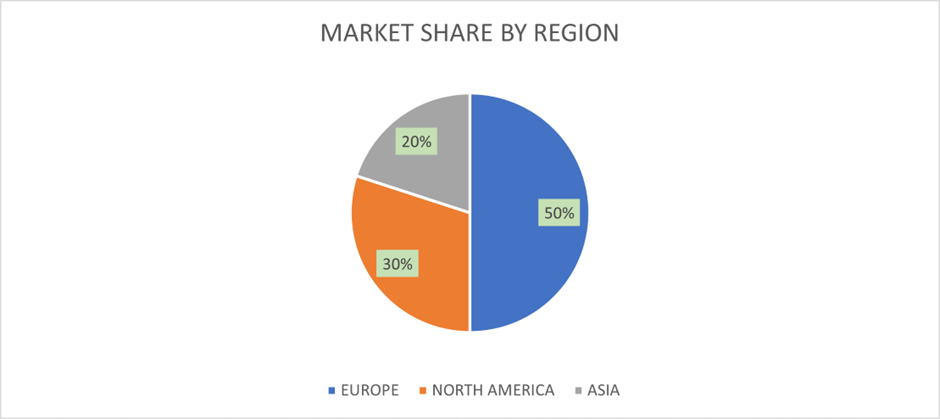
While the U.S. constitutes 30% of the top 10’s value and Japan contributes a fifth, a surprising shift has occurred. The most valuable auto stock, situated in the U.S., has unexpectedly surpassed traditional combustion engine automakers in recent years. This unforeseen advancement reflects the industry’s evolution, driven by emerging technologies like electric vehicles, reshaping the automotive landscape.
Source: Trive – TradingView, Nkosilathi Dube
Automobile Stocks at The Turn of the 21st Century
One of the most significant drivers of automobile company stocks is technological innovation. With the rise of electric vehicles (EVs), autonomous driving technology, and connectivity features, companies that position themselves at the forefront of these advancements often experience a surge in investor interest.
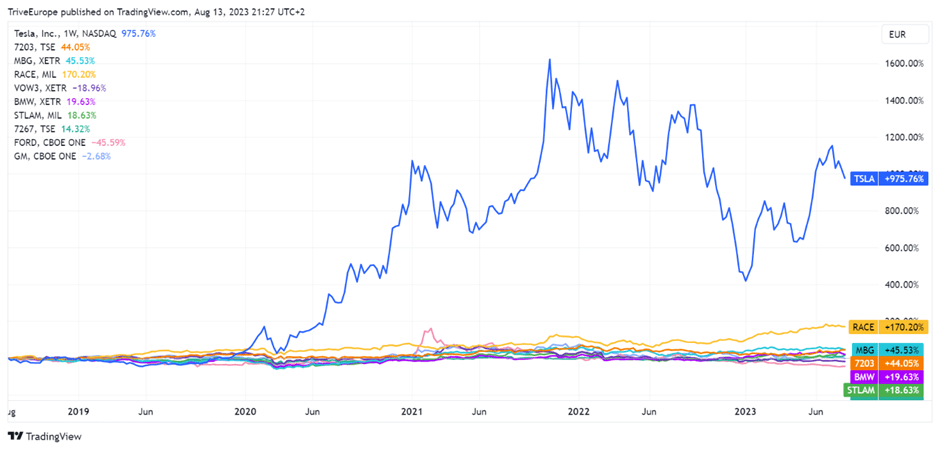
Tesla Motors Inc (ISIN: US88160R1014), one of the pioneers of the Electric Vehicle, is a case in point. The stock is up 975.76% over the past five years and has overtaken all the legacy automakers, which seemed untouchable before.
Source: Trive – TradingView, Nkosilathi Dube
Drawbacks Of Automobile Stocks
Economic cycles and consumer choices wield a direct influence on auto sales. In economic downturns, delayed vehicle purchases dent manufacturer revenues and earnings. This renders auto stocks exceptionally susceptible to economic fluctuations.
Furthermore, vulnerability stems from global emission and safety rules. Adherence and adaptation become a litmus test, shaping the stock performance. Skilful manoeuvring within these regulations often garners investor favour, forming a pivotal element in the intricate interplay of economic forces and market dynamics.
Key Metrics to Follow for Automobile Stocks
Volumes: This metric refers to the number of vehicles sold by the company over a specific period. Tracking sales volumes can help you understand the company’s product demand and market share within the industry.
Inventory Turnover Ratio: This ratio indicates how efficiently a company manages its inventory. It’s calculated by dividing the cost of goaods sold (COGS) by the average inventory during a given period. A higher turnover ratio generally suggests that the company effectively manages its inventory, while a lower ratio could indicate inefficiencies.
Operating Margin: Operating margin is the percentage of revenue that remains as operating income after deducting operating expenses. It’s a measure of how well a company controls its costs while generating revenue. A higher operating margin indicates better profitability, as the company is able to generate more profit from its core operations.
Return on Equity (ROE): ROE measures a company’s profitability in relation to its shareholders’ equity. It’s calculated by dividing net income by shareholders’ equity. A higher ROE indicates that the company is generating a higher return on the investment made by its shareholders.
These metrics provide a comprehensive view of an automobile company’s financial and operational performance. However, it’s important to note that the interpretation of these metrics can vary based on the company’s size, growth stage, and industry conditions. It’s recommended to compare these metrics with those of competitors and industry benchmarks to gain a more accurate perspective on the company’s performance. Additionally, other metrics such as earnings per share (EPS), debt ratios, and cash flow should also be considered for a well-rounded view.
With the industry undergoing transformational changes driven by technology, sustainability, and consumer preferences, investing in this sector requires a blend of knowledge, patience, and a forward-looking perspective.
Sources: Corporate Finance Institute, Reuters, TradingView
This material is provided for informational purposes only and does not constitute financial, investment or other advice. No opinion contained in this material constitutes a recommendation by Trive Financial Services Malta Limited or its author as to any particular investment, transaction or investment strategy and should not be relied upon in making any investment decision. In particular, the information does not take into account the individual investment objectives or financial circumstances of the individual investor. Trive Financial Services Malta Limited shall not be liable for any loss, damage or injury arising from the use of this information.